Elections are about voters and the choices they make. Every two years, Americans cast ballots to pick a new set of leaders in Washington, as well as at statehouses, county offices and city halls nationwide. Every voter has a reason for why they picked a candidate to represent their interests — or, perhaps, why they decided not to participate in an election at all.
AP VoteCast is a survey of that electorate, providing accurate insights into American voters and their opinions as soon as polls close. It’s election research that is accurate, trustworthy and free of partisan bias, empowering your reporting with details about voters that can’t be found from any other source.
AP launched AP VoteCast in 2018 in partnership with NORC at the University of Chicago, one of the world’s leading nonpartisan research organizations. Together, we built AP VoteCast for modern American elections. A nation that once almost always voted in person at a polling place on Election Day now often casts their ballots in advance. It’s no longer enough to interview voters as they exit the polls. That’s why AP built VoteCast to reach voters where they are.
We use a probability-based, state-by-state survey of registered voters conducted by mail, phone and online to capture voter opinions regardless of how and when they cast their ballot. We add to that a survey of self-identified registered voters using online panels, which allows AP to interview a very large number of people in just a few days. It’s an approach that ensures our survey data is both comprehensive and presents the most accurate picture possible of who has voted, and why.
In midterm and presidential elections, we ask voters in every state to tell us what they think about national issues such as healthcare, climate change, education and the economy. We also ask about the topics driving conversations in their state. Only with AP VoteCast will you know what voters in Tennessee think about Taylor Swift, and who voters in Alabama back on college football Saturdays: Auburn or Alabama.
VoteCast empowers you to provide your audience with in-depth understanding — and helps you help them make sense of what takes place on Election Day.
Frequently asked questions
AP VoteCast is a survey of the American electorate aimed at telling the story of why the winners won. It is designed to reveal the opinions held by American voters about candidates, the issues voters care most about and their views on the future of the country. It is a survey that helps power AP’s race calls on election night and ensures AP’s members and customers can tell the full story of elections in America.
It offers insight – available starting at 5 p.m. ET on the day of an election – about registered voters who cast a ballot, as well as those who decide not to vote.
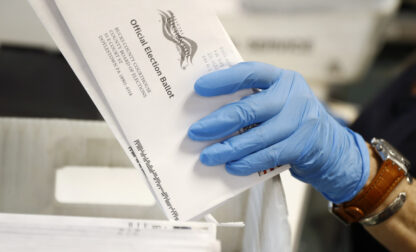
It is not an exit poll, as it is not based on in-person interviews conducted at polling locations. Instead, AP VoteCast uses a combination of mail, phone, and online research to meet voters where they are — increasingly, that’s casting a ballot before Election Day by mail, absentee or via in-person early voting.
AP VoteCast is conducted by The AP-NORC Center for Public Affairs Research for The Associated Press and Fox News, along with other news organizations.
AP VoteCast is the product of more than a decade of research and years of experiments aimed at moving away from traditional, in-person exit polls to an approach to election research that reflects the modern approach to voting in America – at polling places, yes, but in increasing numbers before Election Day – both in person and by mail. It captures the opinions of people who vote early or on Election Day, and registered voters who decide not to cast a ballot.
AP VoteCast returns results in every state holding an election for U.S. Senate or governor in a midterm election year, and in every state in a presidential election year.
Since its debut in 2018, it has become a resource to examine how the American electorate has changed. AP is committed to ensuring AP VoteCast provides a robust data set in every midterm and presidential election, as well as in presidential primaries, allowing for rich longitudinal comparisons and exceptional journalism.
AP conducted research aimed at uncovering ways to improve the accuracy of data collected about the electorate. That work is the foundation of AP VoteCast’s modern approach to election research.
To develop AP VoteCast, AP worked with NORC at the University of Chicago — one of the world’s preeminent objective, nonpartisan research institutions and AP’s partner in The AP-NORC Center for Public Affairs Research. AP and NORC worked with Fox News in 2017 to test in three statewide elections the methodology that would debut as AP VoteCast in the 2018 midterm elections.
Our research and development into AP VoteCast continues after every election. While the core methodology will not change, AP and NORC apply what we learn from the results of every election and update the methodology as needed to ensure AP VoteCast delivers the most accurate results possible.
Starting several days before Election Day and concluding as polls close, AP VoteCast interviews thousands of registered voters in English and Spanish.
The AP VoteCast questionnaires ask a standard set of demographic questions, such as age, race and ethnicity, education level and income. It also includes a series of opinion questions, seeking details on what issues voters care most about, their thoughts on the direction of the country and their opinions on a variety of topics that are specific to their state. The questionnaire also asks for whom voters cast a ballot for president, U.S. Senate and governor, as well as the party of their candidate of choice for U.S. House.
AP VoteCast starts with a postcard, mailed to a random sample of registered voters in selected states, inviting them to take our survey either online or by phone. We also call some of those registered voters directly by phone. AP VoteCast also surveys self-identified registered voters using online panels, which allows AP to interview a very large number of people in just a few days. In general elections, AP VoteCast also includes a national random-sample survey of registered voters from NORC’s AmeriSpeak® Panel.
In presidential primary elections, respondents who take the survey at least three days before an election are asked to take part in the survey again no more than two days before Election Day to confirm their vote choice.
NORC then employs an innovative statistical calibration methodology to combine the random sample surveys of registered voters with the poll conducted via online panels. In doing so, AP VoteCast gets the best of both approaches. It delivers the accuracy of a survey conducted with a random sample but also provides the research depth of a survey that interviews tens of thousands.
The final step in this process adjusts the AP VoteCast results with the actual vote count. Because of the large AP VoteCast sample, this process is completed in as many as 30 separate areas of a state, further adding to the survey’s ability to accurately reflect the opinions of voters.
For years, AP was part of the consortium of media companies that conducted election research with an in-person exit poll.
An exit poll is exactly what it sounds like: a survey of voters interviewed in person as they “exit” a neighborhood polling place. That approach no longer works for how America votes today. In 1972, when President Richard Nixon was reelected, 95% of voters cast a ballot in person on Election Day.
In 2018, roughly 43% of voters cast their ballots before polls opened on Election Day – a number that grew to 70% in the 2020 presidential election. While that spike was driven by the coronavirus pandemic, it’s clear that Americas have embraced voting early, and any survey of the electorate needs to take that into account.
AP VoteCast is built for modern American elections, and as a result, delivers accurate, unbiased results that journalists, academics, and others can depend on.
How the AP declares election winners
In this video, discover how AP goes beyond just focusing on key battleground states. We believe every vote counts and any state could be the one to determine the outcome. With a dedicated research team monitoring the latest election trends and rules, we are the trusted source for election results, ensuring that Americans know the outcome as soon as it’s certain.
Elections