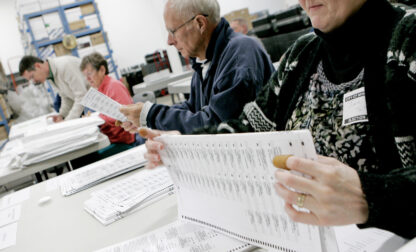
How AP counts the vote
Discover


As interest grows in the 2026 midterms through to the 2028 presidential elections, we can help you grow reach and deepen engagement across all channels.
Vote Count
Results data and graphics for national, state and local elections.
Elections Pro
Candidate photos, map files and digital voter guides.
The Voter Poll
A survey that provides the “why” of Election Day.

Learn how AP Elections can advance your business.
AP Elections helps you turn attention into audience and revenue growth, making it easy to provide full coverage of what’s happening on Election Day.
Become your audience’s go-to source for the U.S. elections by using our data, visuals and context to enhance your own reporting.
AP Elections helps you raise the bar on your coverage, giving you access to the same election night resources as the world’s leading media, financial and technology companies.
AP Elections makes it easy to integrate trusted results and coverage into your platforms, regardless of your team’s size or tech infrastructure.
AP Elections data helps you understand the choices made by the U.S. electorate and their implications for the country, the world — and your organization.
AP Elections data helps you find patterns and improve forecasts by bringing real-time and historical U.S. voting into your models.
AP Elections data helps you track and monitor U.S. elections results, so you can better manage risks and find opportunities.
Learn how AP Elections results and coverage can advance your business.

This page is not available in your selected language. You are now viewing the English version.